All posts
What Every Body Fat Percentage Actually Looks Like (5% to 50%)
See what body fat percentages from 5% to 50% look like, plus how sex, muscle, lighting, fat distribution, and measurement change appearance.
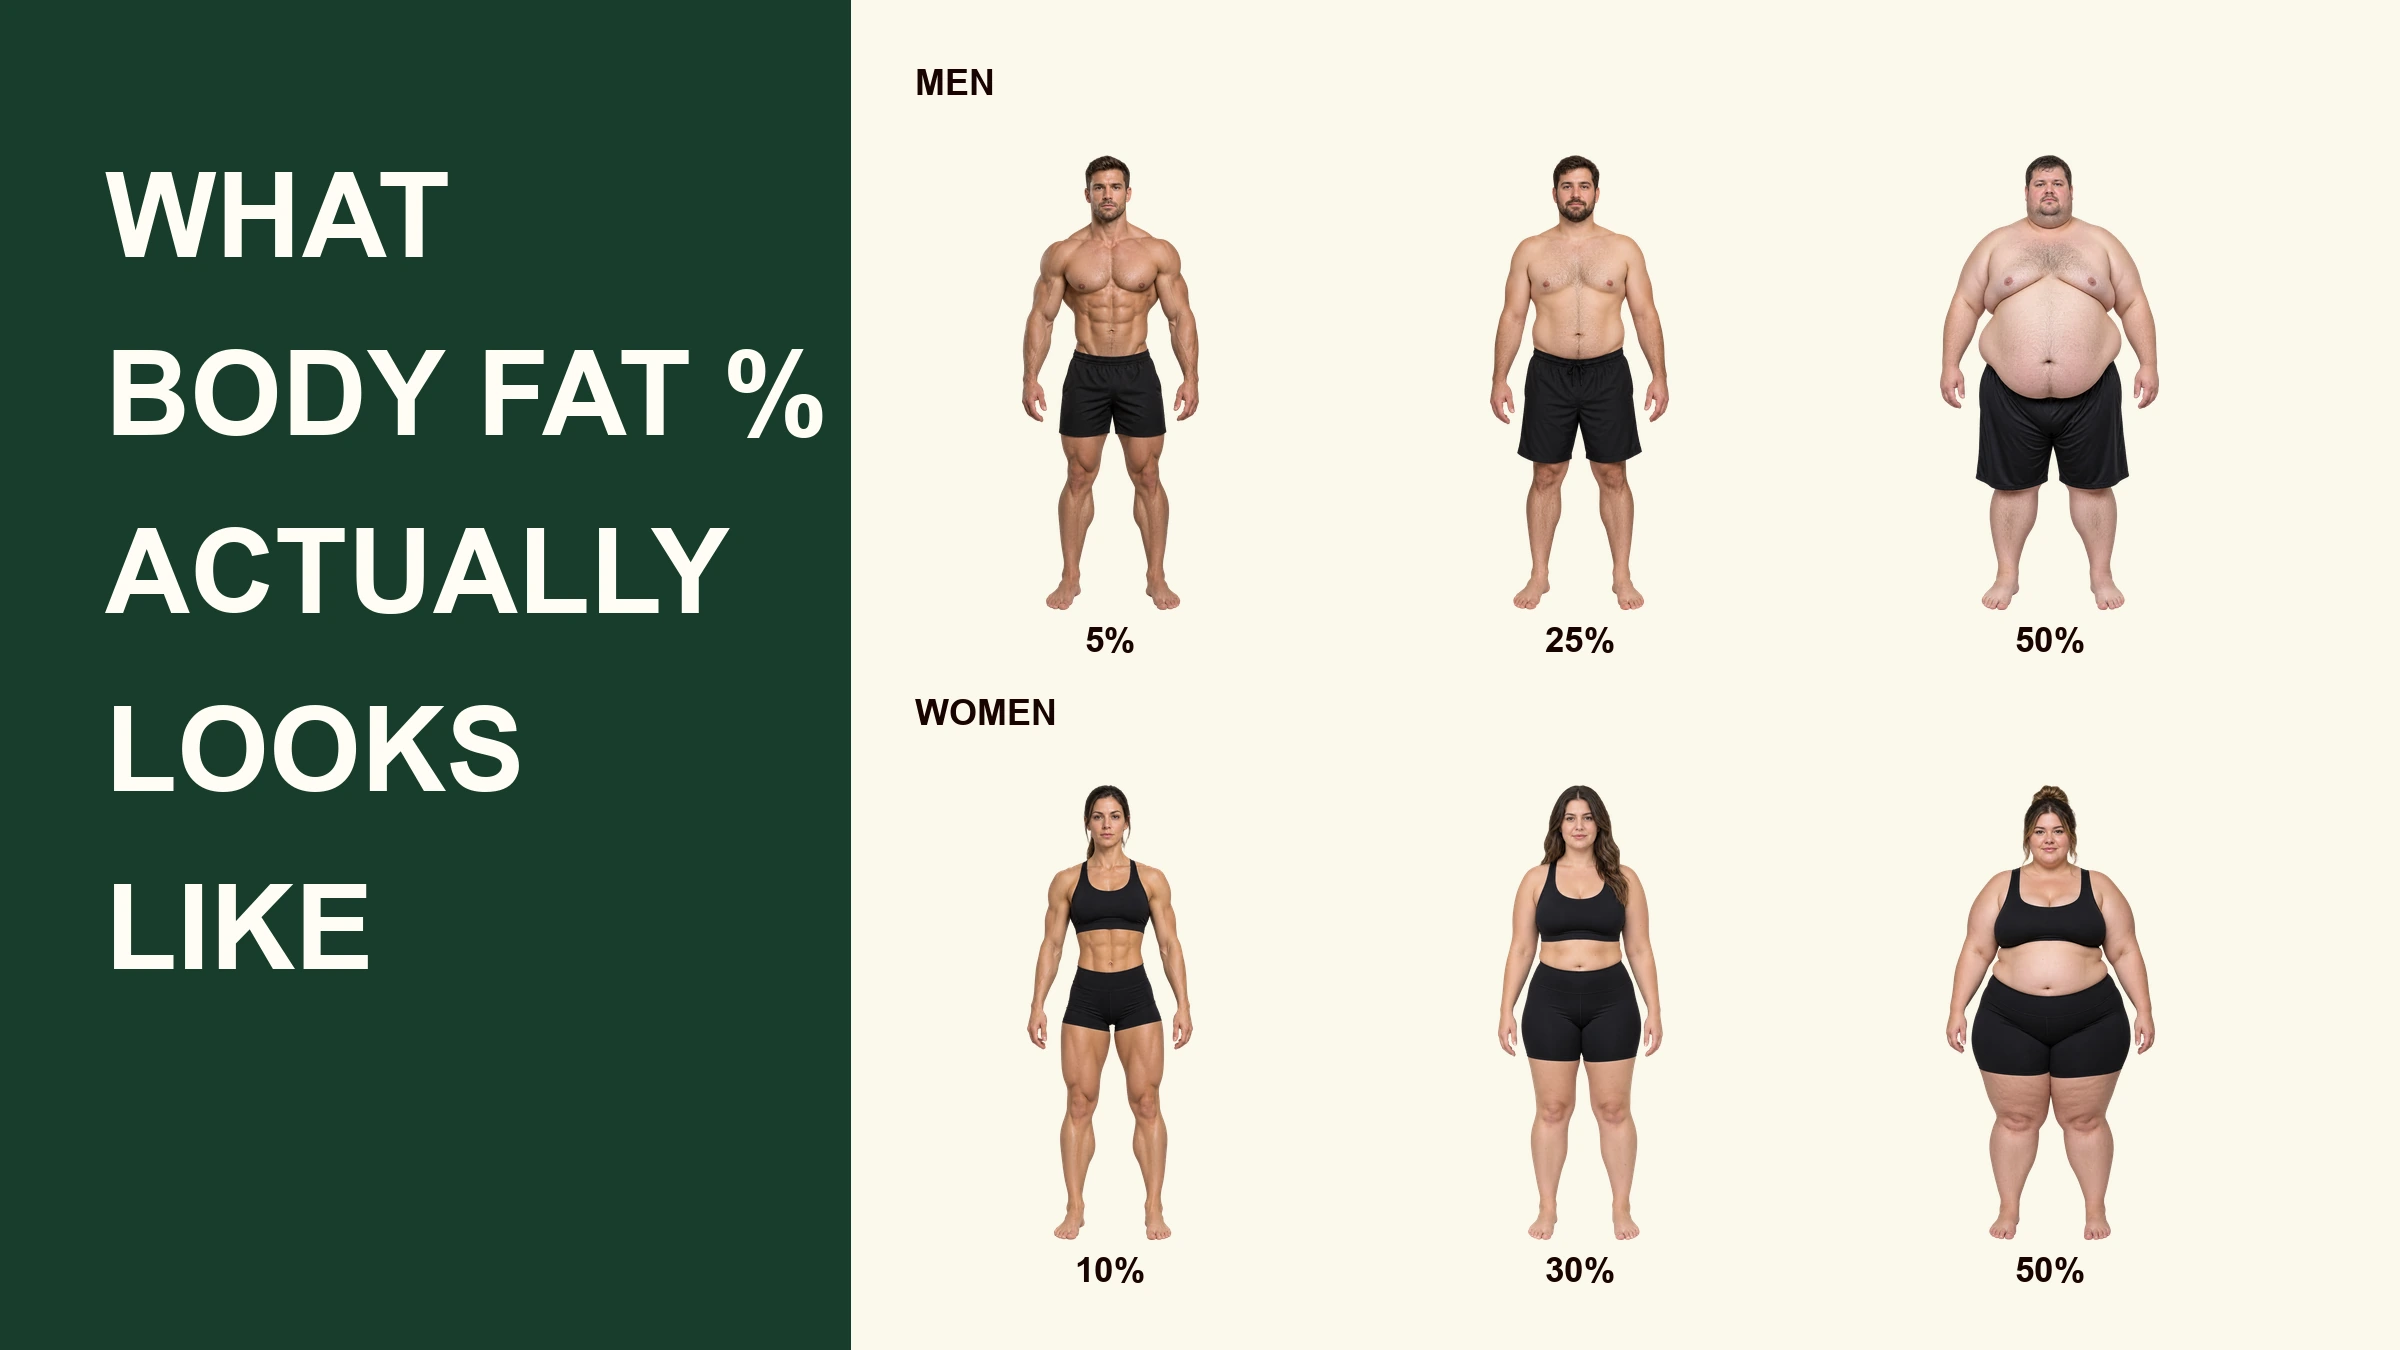
Body fat percentage changes the outline of a body, but it does not create one universal look. Two people can measure at the same percentage and look very different because they carry different amounts of muscle and store fat in different places.
This guide shows the broad visual pattern from very low to very high body-fat levels using selected reference points. It is a visual reference, not a way to diagnose your body from a photo.
How to read the images: These are synthetic visual references, not photographs of people whose body fat was clinically measured. Each figure was created separately, then normalized to the same displayed height and floor line. Use the images to understand the broad progression, not to assign an exact percentage to yourself or someone else.
Body fat percentage chart: 5% to 50%
Men

Left to right: 5%, 10%, 15%, 25%, 35%, and 50%.
Women

Left to right: 10%, 15%, 20%, 30%, 40%, and 50%.
We do not show a 5% female reference because that is not a responsible representative target. A 2025 DXA study of 643 competitive athletes found approximate lower observed limits of 10% for men and 16% for women. The researchers did not claim those limits were healthy targets.
What each body fat percentage usually looks like
5% body fat
Men: This is extremely lean. Muscle separation may be sharp across the abdomen, shoulders, chest, and legs. Veins may be prominent. Very little softness is visible around the waist.
Women: A true 5% measurement would be extraordinarily low. It sits well below commonly cited essential-fat ranges for normal physiological function. It should not be treated as a normal appearance goal.
At this level, the measurement method matters enormously. A device can report 5% while another method produces a different number.
10% body fat
Men: Abdominal definition is usually clear, including when the muscles are relaxed. The waist appears narrow, and separation may be visible in the chest, shoulders, and legs.
Women: This remains an extremely low level. A visual guide can show what the number implies, but a photo cannot establish that someone is actually at 10%.
15% body fat
Men: The abdomen often remains visibly defined, though the separation is softer than at 10%. Arms and shoulders can look athletic without the dry appearance associated with very low levels.
Women: This is near the lower end seen in some athletes. Definition may be visible around the abdomen, shoulders, and legs, but the look depends heavily on muscle mass.
20% body fat
Men: The body may look fit with a softer midsection. Upper abdominal lines may remain visible in favorable lighting, while lower-abdominal definition is usually less distinct.
Women: The waist is often clearly shaped, with athletic definition possible in the arms and legs. A person with more muscle can look substantially leaner than another person at the same percentage.
25% body fat
Men: Abdominal definition is usually limited. The torso appears softer, though shoulder, chest, and arm shape can remain obvious.
Women: The waist and hips usually remain distinct. Some abdominal softness is common. Muscle developed through training may still be easy to see in the legs and shoulders.
30% body fat
Men: More fat is commonly visible around the waist, lower abdomen, chest, and back. The exact outline depends on whether someone tends to store more fat centrally or more evenly.
Women: The waist may become less pronounced, with more visible fat around the hips, thighs, abdomen, and upper arms. Distribution varies widely.
35% body fat
Men: The abdomen is generally fuller, and muscle definition is limited even when the person has significant lean mass underneath.
Women: The midsection, hips, thighs, and upper arms are generally fuller. Some people keep a defined waist, while others store more fat around the abdomen.
40% body fat
Men: The torso and abdomen are visibly fuller. Fat may also be more apparent around the chest, back, face, and limbs.
Women: The abdomen, hips, thighs, arms, and face may all appear fuller. The waist-to-hip shape can still vary dramatically between people.
45% body fat
At 45%, the difference between two bodies can still be substantial. Height, frame size, muscle, age, and fat distribution change the silhouette. Photos also hide the distinction between subcutaneous fat under the skin and visceral fat around internal organs.
50% body fat
At 50%, roughly half of total body mass is estimated to be fat mass. That number still does not reveal a person's health by itself. Blood pressure, blood sugar, fitness, sleep, medications, medical history, and fat distribution provide additional information that appearance cannot.
Why the same body fat percentage can look completely different
Muscle changes the shape underneath
A muscular person at 20% can appear leaner than a less muscular person at 20%. The percentage is a ratio. It does not tell you how much total muscle the person has.
Fat is stored in different places
Research consistently finds sex-linked differences in average fat distribution. Men more often store a larger share around the trunk and abdomen. Women more often store a larger share around the hips and thighs. Individual genetics, hormones, age, and health can override that average pattern.
A review of sex differences in body composition describes these average central and lower-body patterns. They are tendencies, not rules.
Age changes composition
People often lose muscle and redistribute fat as they age. Two people with the same body weight and body-fat estimate can therefore have different outlines at different ages.
Lighting and posture are powerful
Side lighting reveals lines that flat lighting hides. Flexing, twisting, inhaling, posing, dehydration, and a camera placed slightly above the waist can all change the apparent result. That is why social-media comparisons are especially unreliable.
The number itself is an estimate
There is no error-free consumer method. An Obesity Medicine Association clinical statement notes that calipers depend heavily on the operator, bioelectrical impedance varies with hydration, and even DXA has equipment and body-size limitations.
Body fat categories are different for men and women
The Obesity Medicine Association publishes one commonly used classification:
Category | Women | Men |
Essential fat | Below 15% | Below 10% |
Athlete | 15% to 19% | 10% to 14% |
Fitness | 20% to 24% | 15% to 19% |
Acceptable | 25% to 29% | 20% to 24% |
Pre-obesity | 30% to 34% | 25% to 29% |
Obesity | 35% or higher | 30% or higher |
These categories are population-level reference points. They do not diagnose an individual, and different professional organizations use somewhat different cutoffs.
How to estimate your body fat percentage
DXA scan
DXA estimates fat mass, lean mass, and bone mineral. It is useful, but it is not perfectly interchangeable with another method or even every other DXA machine.
Bioelectrical impedance
Smart scales and handheld devices estimate body composition from electrical resistance. They are quick, but hydration, food, exercise, and device equations can move the result. Use the same device under similar conditions if you want to follow a trend.
Skinfold calipers
A trained person measures skinfold thickness at specific sites. The technique can be useful for tracking change, but operator skill matters and very high skinfolds can exceed the practical range of the calipers.
Tape-measure formulas
The U.S. Navy-style method estimates body fat from height and body circumferences. It is convenient and repeatable at home. It is still an estimate.
For progress, consistency matters more than chasing a supposedly perfect method. Measure under similar conditions and follow the trend.
Frequently asked questions
What does 10% body fat look like?
In men, 10% body fat usually produces clear abdominal definition, a narrow waist, and visible muscle separation. In women, 10% would be extremely low and should not be inferred from appearance alone.
What does 15% body fat look like?
In men, 15% often looks athletic with visible but softer abdominal definition. In women, 15% is near the low end observed in some competitive athletes and may show substantial muscular definition.
What does 20% body fat look like?
At 20%, men often look fit with some softness through the lower abdomen. Women may have a defined waist and visible shape through the arms and legs. Muscle mass creates large visual differences at this level.
What does 25% body fat look like?
At 25%, men usually have limited abdominal definition but may retain obvious muscle shape. Women often have a distinct waist and hips with more softness through the abdomen and thighs.
What does 30% body fat look like?
At 30%, the abdomen and torso tend to appear fuller in men. Women often show more fullness through the abdomen, hips, thighs, and upper arms. Distribution can make two people look very different.
What does 40% body fat look like?
At 40%, the torso and limbs generally appear fuller. Central versus lower-body fat distribution still changes the silhouette substantially, so a photograph cannot confirm the number.
What does 50% body fat look like?
At 50%, about half of estimated body mass is fat mass. Height, muscle, age, and distribution still influence appearance. The percentage alone does not describe a person's complete health.
Can you tell body fat percentage from a picture?
Not precisely. Even trained visual estimation has limits. A photograph changes with pose, lighting, clothing, lens, and muscle mass. Use a measurement method if the number matters, then compare future measurements using the same method.
Is body fat percentage more useful than BMI?
It answers a different question. BMI relates weight to height. Body fat percentage estimates how much body mass is fat. Neither value captures the full picture of health, and both should be interpreted with other information.
The number is useful. The trend is usually more useful.
A body-fat chart helps translate an abstract percentage into a rough visual idea. It cannot tell you exactly what your body should look like.
If you are tracking change, choose one measurement method, repeat it under similar conditions, and watch the direction over time. BodyBuddy can help you keep the daily nutrition, movement, weight, and follow-through around that goal in one ongoing text conversation.
Related BodyBuddy guides
- How to lose belly fat: what the science actually says (not what Instagram tells you)
- What to eat before a HYROX race: race week, the night before, and race morning
- What to eat before a long hike: the week before, the night before, and the trail
- What to eat the week before a marathon: a 7-day carb-loading plan
- Cristiano Ronaldo's Daily Routine: Diet, Workout, Sleep & Recovery
Everyone gives you a plan.BodyBuddy texts you until it happens.
BodyBuddy keeps you on track—from meals to doctor's appointments and everything in between.